
How to use
Open Research Research
Sentiment measures the tone of Oyticker's stories (the Oyticker index, from 0 negative to 100 positive) and sets it against the market's own mood: Fear & Greed, risk appetite and volatility. When the two disagree, the page says so. Each sector has its own page with its stories.
The dashboard
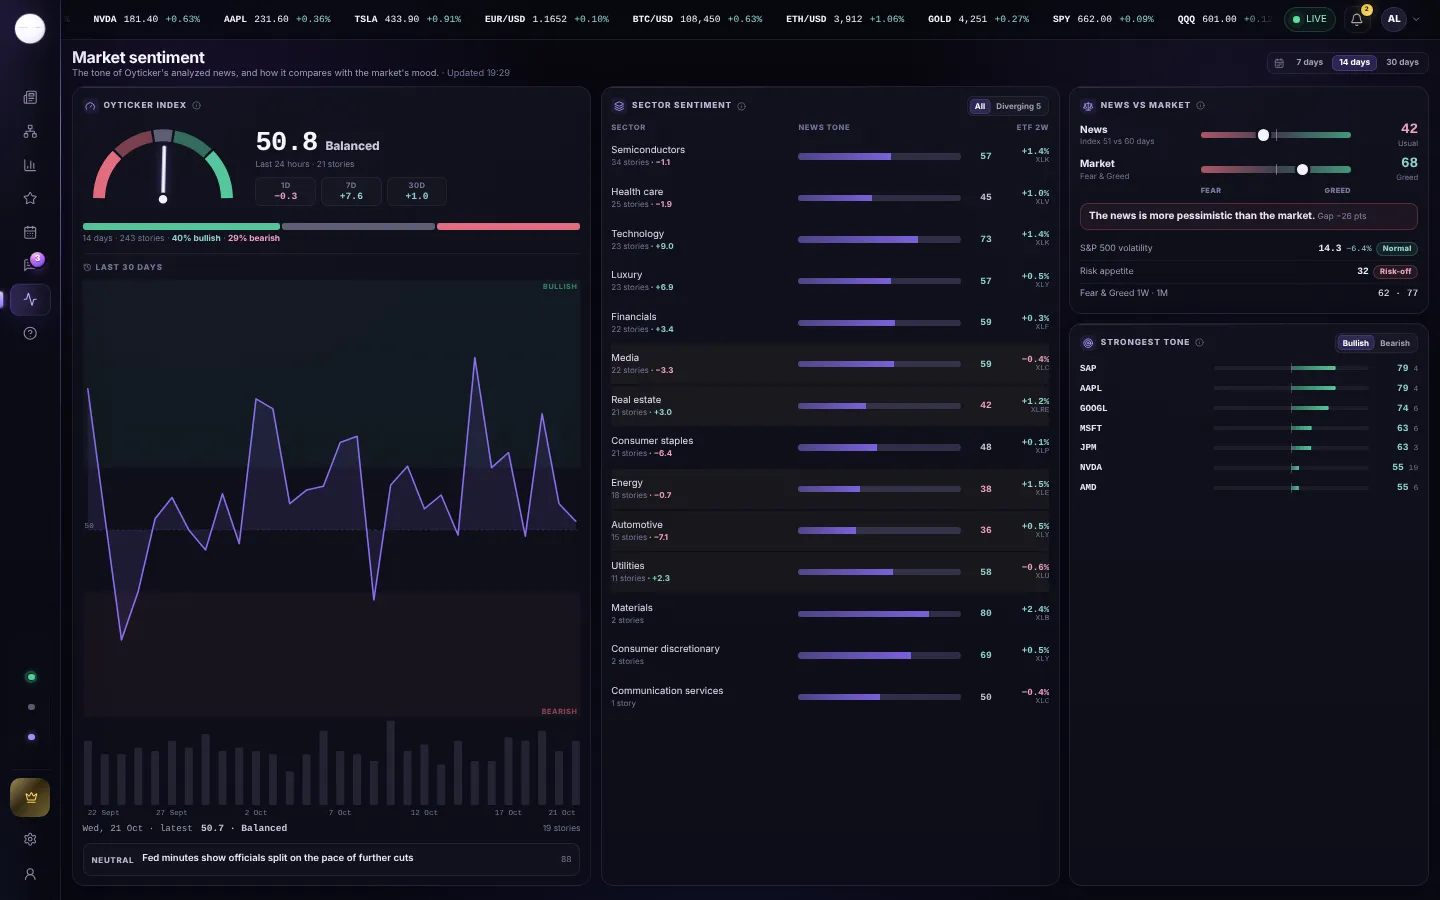
- Window7, 14 or 30 days for the tone, the sectors and the strongest markets.
- Oyticker indexThe tone of the last 24 hours of stories, weighted by impact: under 45 negative, 45 to 55 balanced, over 55 positive.
- ChangesAgainst a day, a week and a month ago.
- 30 daysThe index day by day and the number of stories. Point at a day for its key story.
- Sector sentimentEach sector's tone and its ETF's return. Diverging lists the sectors where news and prices disagree.
- News vs marketThe news mood against the market's Fear & Greed, and whether they agree.
- Strongest toneThe markets with the most positive and most negative stories (3 stories or more). Click one to open it in Charts.
News against the market
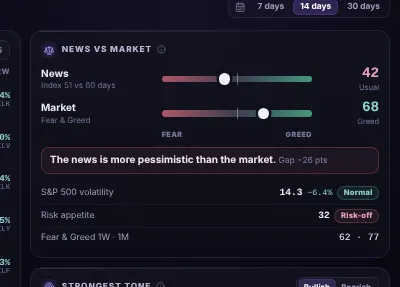
- NewsWhere today's index sits among the last 60 days: from very gloomy to very upbeat.
- MarketFear & Greed, from extreme fear to extreme greed, computed from prices.
- VerdictWhether news and market agree, or which one is more optimistic, and by how many points.
- Risk figuresS&P 500 volatility and its regime, risk appetite (risk-on or risk-off), and Fear & Greed a week and a month ago.
A sector page
Click a sector in the dashboard to open its page.
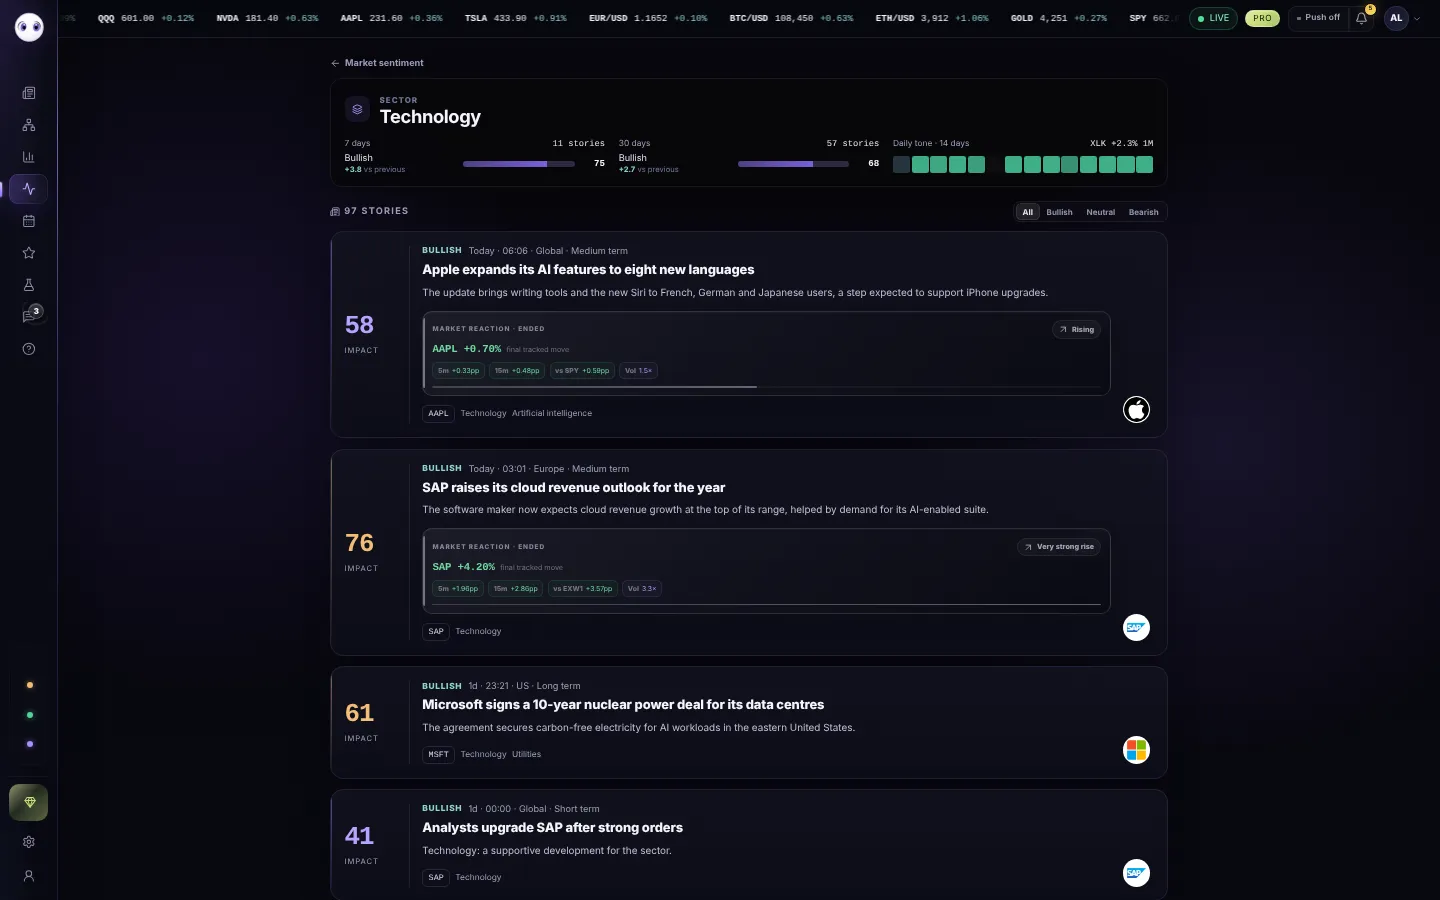
- ToneOver 7 and 30 days, against the previous period, and the number of stories.
- Daily toneThe last 14 days, and the sector ETF's return over a month.
- FilterAll the sector's stories, or only positive, neutral or negative ones.
- StoriesNewest first, 20 per page.
Screenshots use simulated prices and stories.