
How to use
Open Compare Compare
Compare puts a second asset next to the one you are analysing, in Analyze. See both charts side by side or on one chart, measure which one did better and by how much, and compare their figures, risk and news. Open it with the Compare button of Charts or Analyze; your analysis of the first asset is kept and comes back when you leave.
Choosing the second asset
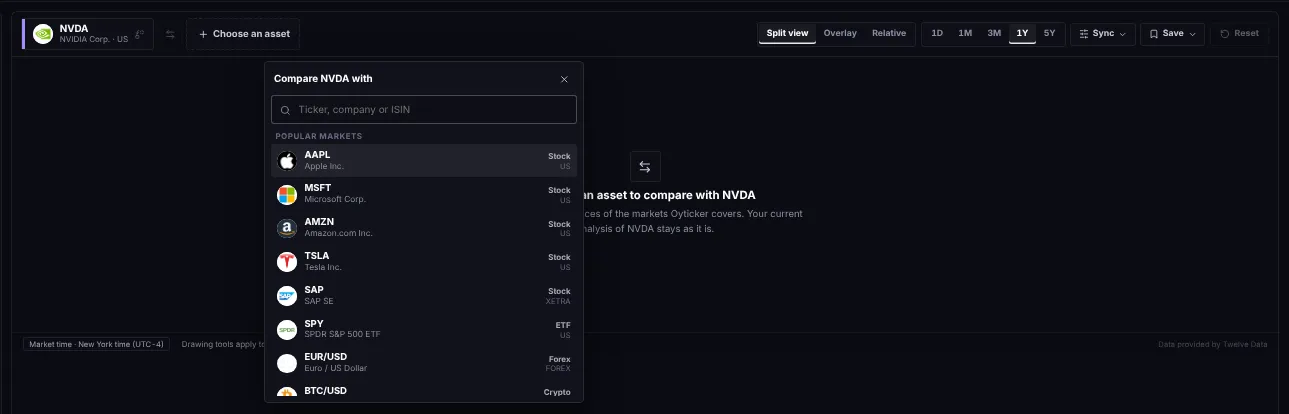
- SearchA ticker, a company or an ISIN: stocks, ETFs and indices.
- SuggestionsYour watchlist and popular markets first. Pick one to start the comparison.
Split view
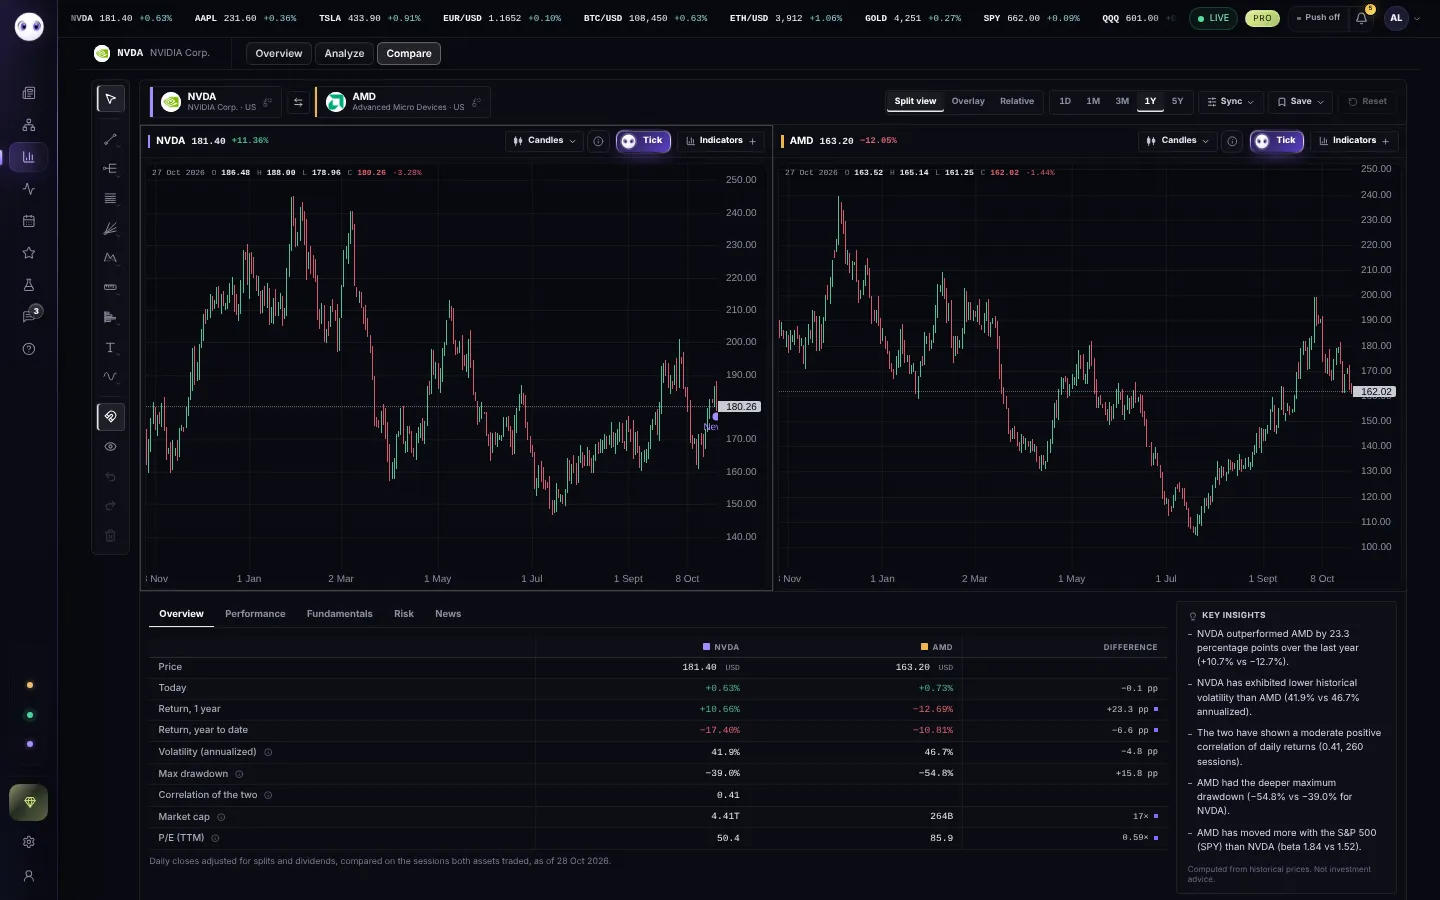
- The two assetsClick one to replace it. The arrows swap them.
- ToolbarSplit view (two charts), Overlay (one chart, two lines) or Relative (the gap between them); the period, for both charts at once; Sync, to keep the period, the crosshair and the zoom in step and copy indicators from one chart to the other; and Exit, back to Analyze with your analysis of the first asset as you left it.
- Each chartIts own chart type, indicators, drawings and Tick button. The drawing tools act on the chart marked Tools: click a chart to make it active.
Overlay and Relative
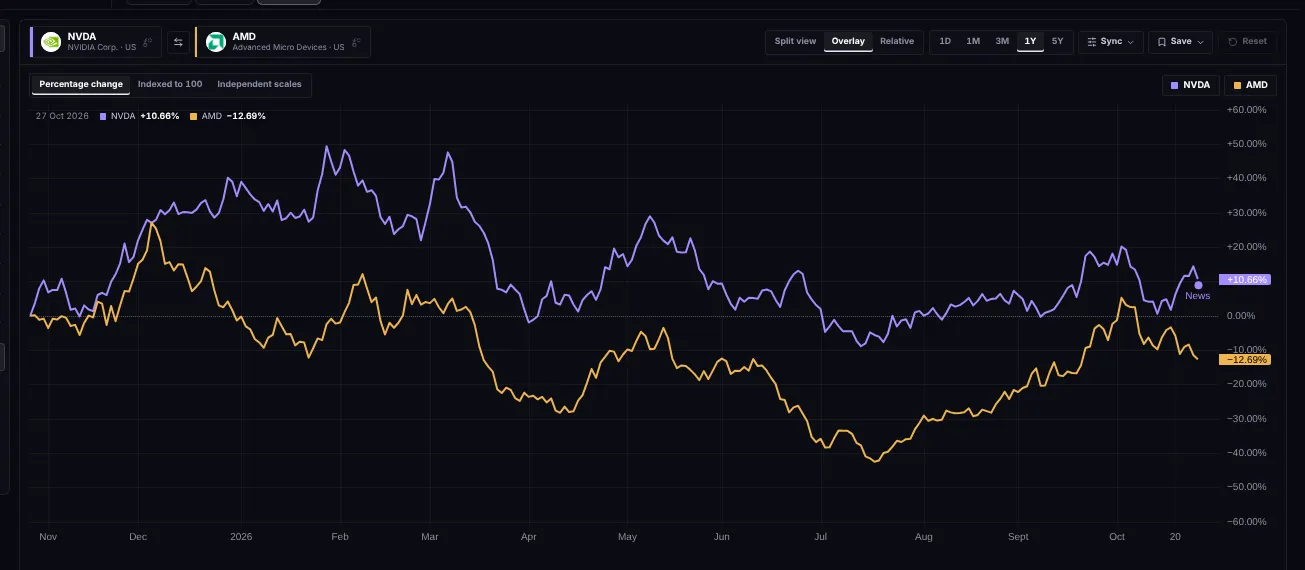
- ScalePercentage change from the start, Indexed to 100, or Independent scales to compare shapes rather than levels.
- LegendClick an asset to hide or show its line.
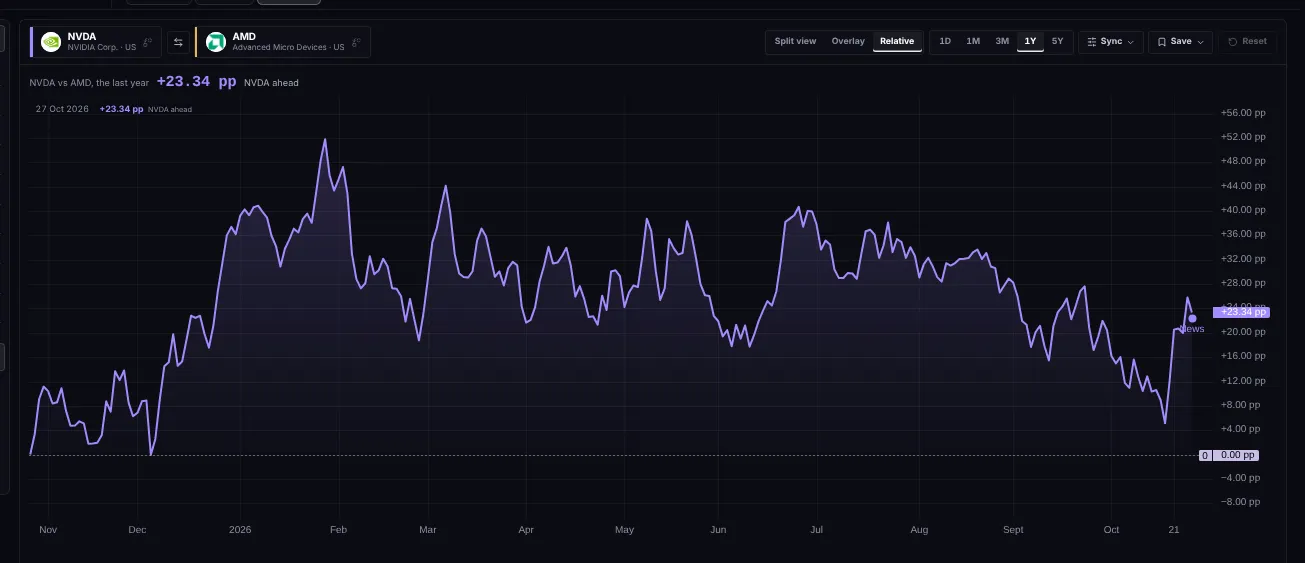
- Who is aheadThe gap between the two over the period, in percentage points, and which one leads.
Figures side by side
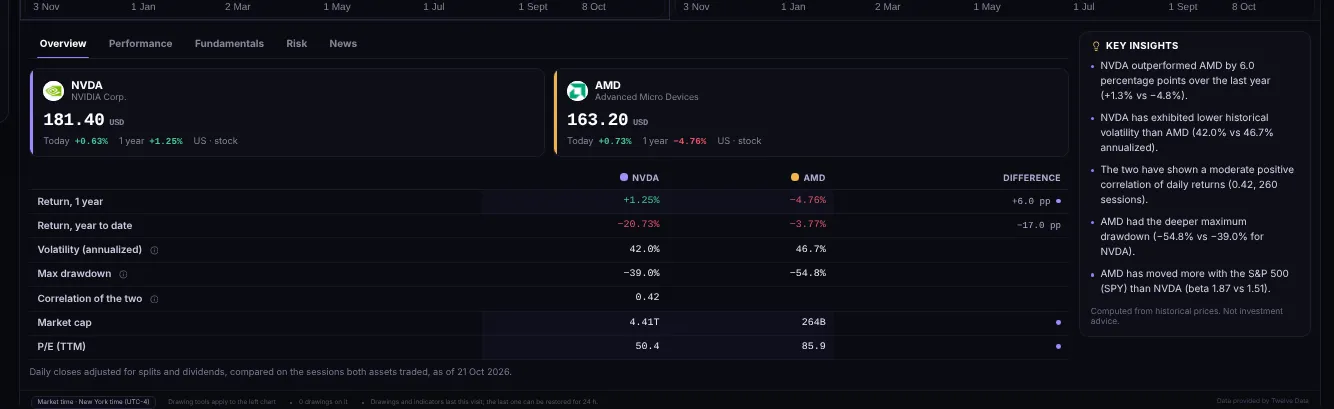
- Five sectionsOverview, Performance, Fundamentals, Risk and News, for both assets.
- The two assetsPrice, change and period return of each.
- Big gapsA dot marks figures that differ a lot (1.5 times or 5 points).
- Key insightsWhat stands out between the two, in plain words.
Saving and exporting

- ExportProThe chart as an image (PNG), or the two price series and their gap as a spreadsheet (CSV).
Free comparisons
Free members get 3 comparisons a day. Reopening a pair you already compared is free, in any order. Plus and Pro compare without limit.

- Comparisons left todayCounts down with each new pair.
Screenshots use simulated prices and stories.