
Domino
When a US company reports after the close and its stock moves 2% or more after hours, its European links (competitors, suppliers, customers, companies of the same theme) often open the next morning in the same direction. Domino measures each link on ten years of reports, projects tonight's European open, then scores every projection against the real open, misses included.
An earnings night
The board follows one night, from the US close to the European open. The timeline at the top shows where it stands; the map in the middle draws tonight's reports and their European links; the panel on the right explains the link you select.
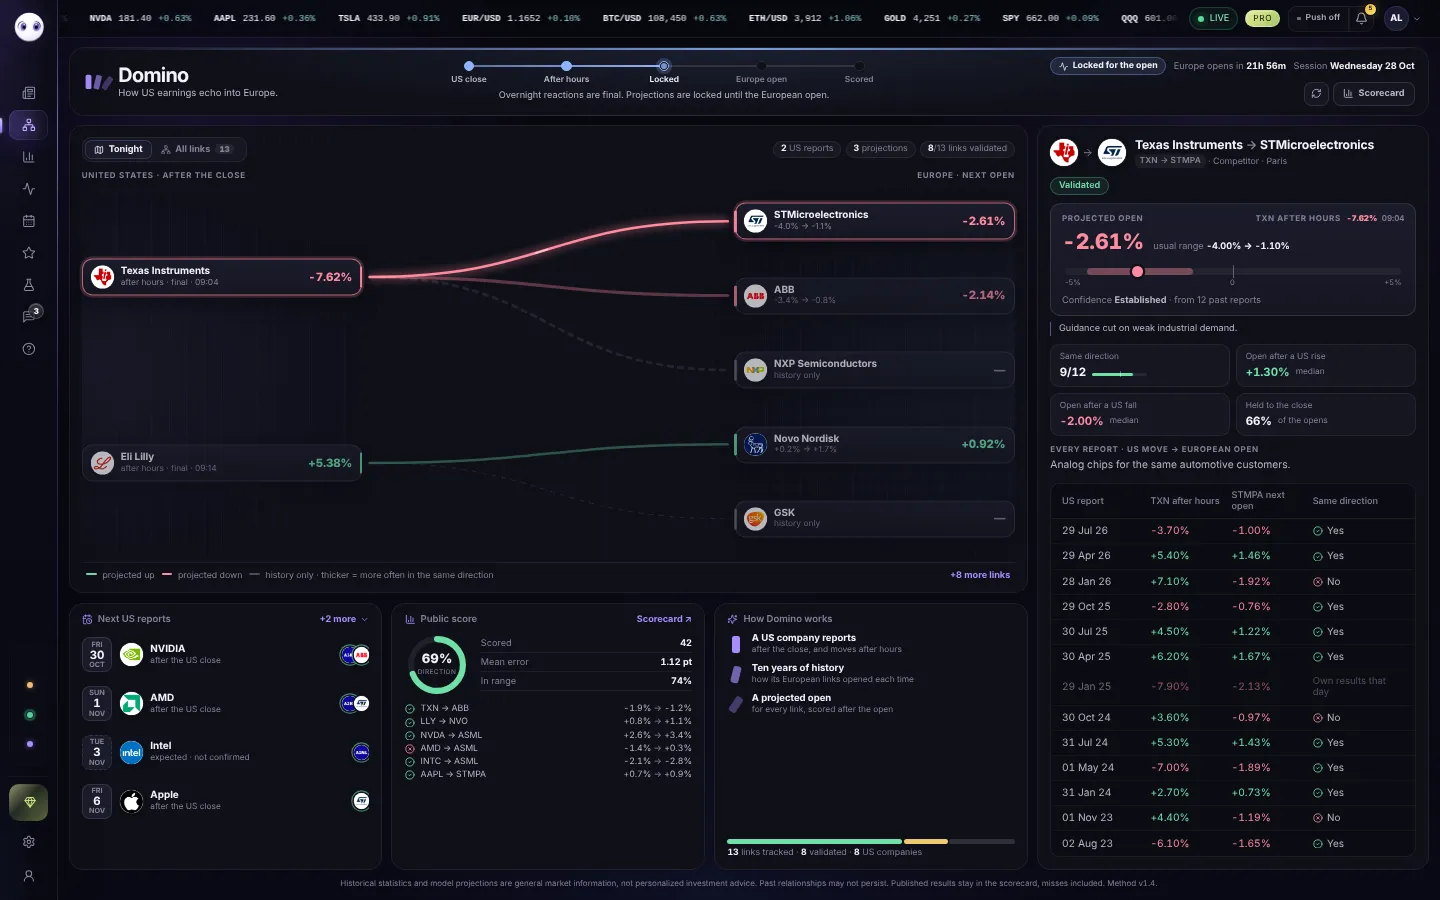
- Night timelineUS close → After hours → Locked → Europe open → Scored. The lit step is where the night stands.
- StateLive after hours, Locked for the open, Europe open, Session scored… or Quiet night when no tracked report is in play.
- CountdownTime left before the European open.
- US reportsTonight's reporting companies and their after-hours move.
- European linksEach linked stock and its projected open. Click a line or a name to see it in detail.
- Selected linkThe projection, its usual range and every past report of the link.
- Next US reportsThe coming reports of tracked companies and their European links. ≈ marks a date that is expected, not confirmed.
- Public scoreHow often published projections got the direction right, their average error, and the last results.
The map
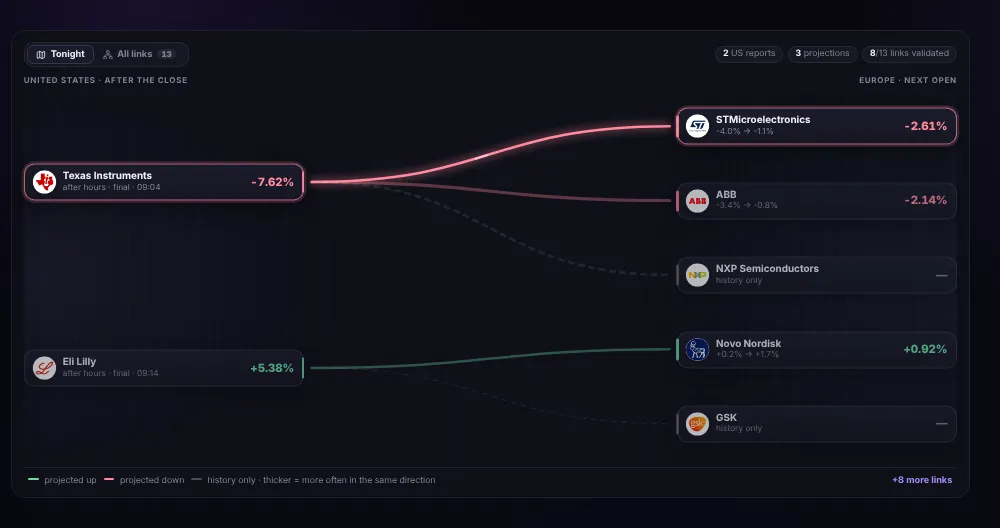
- Tonight and All linksTonight's map, or the list of every tracked link.
- Tonight in figuresUS reports in play, projections made, and how many links are validated.
- A US reportThe company, its after-hours move and the time it was read.
- Projected openThe European stock's projected opening move. After the open, the real move with a ✓ or ✗.
- How to read the linesGreen: projected up; pink: projected down; dashed: history only. The thicker the line, the more often the two moved in the same direction.
A link in detail
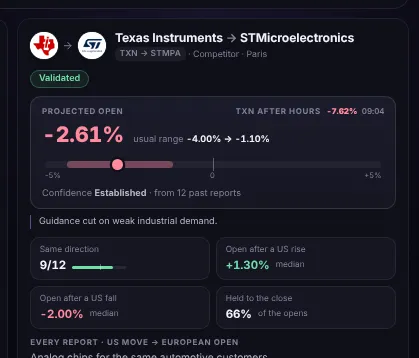
- The linkUS company → European stock, why they are linked, and the European exchange.
- StatusValidated links passed Domino's statistical tests. Others are building their sample, not reliable, or missing data.
- Projected openThe projected opening move and its usual range, from the link's past reactions to moves of this size.
- Range barThe usual range around zero, and the projection inside it.
- ConfidenceStrong, established or limited, and how many past reports it rests on.
- StatisticsHow often the two moved in the same direction, the median open after a US rise and after a US fall, and how often the move held to the close.
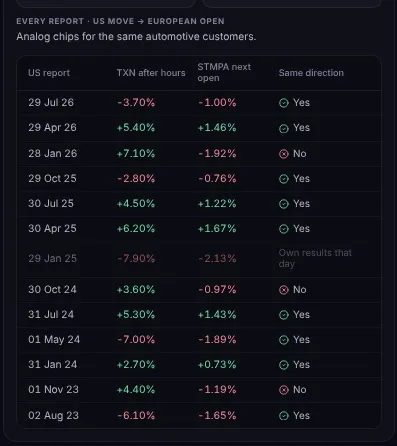
- Every reportEach past report: the US after-hours move, the European open the next morning, and ✓ when they went the same way.
- Left outReports that cannot be compared fairly (the European company's own results that day, a split, a holiday…) are shown but not counted.
After the European open
At 9:00 Paris time the real opening moves come in. Each projection gets a ✓ when the direction was right and is checked against its range. Opening moves are marked provisional until the official end-of-day prices confirm them.
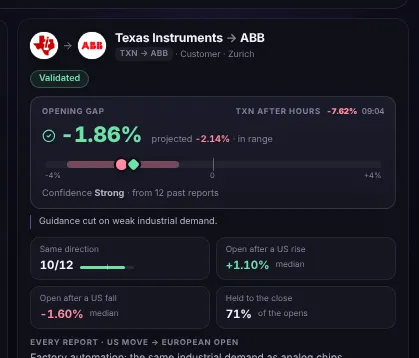
- Real opening moveThe real move at the open, with the projection and whether it stayed in range.
- Both on the barThe projection and the real move side by side on the usual range.
Indicative projections
A link that has not passed validation yet can still get a projection, marked ≈ and Indicative: it comes from the link's own past reports, or from the usual reaction of Domino's other links. Indicative projections are scored like the others and marked ≈ in the scorecard.
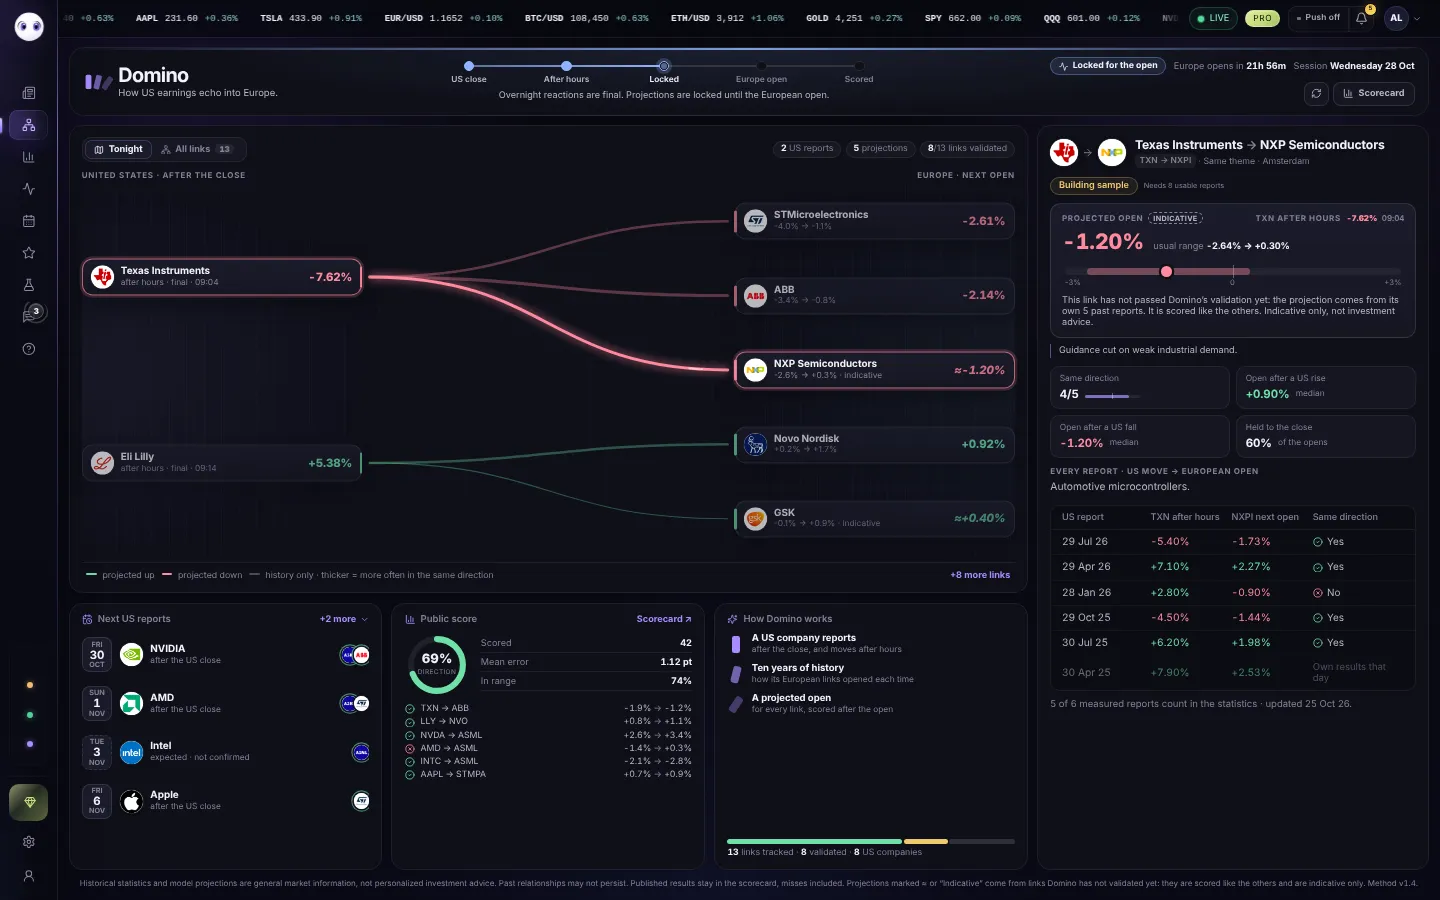
- ≈ on the mapIndicative values are written in italics, after ≈.
- IndicativeThe Indicative chip: the link has not passed Domino's validation yet. The note gives the basis of the projection, and the reminder that it is indicative only, not investment advice.
All links
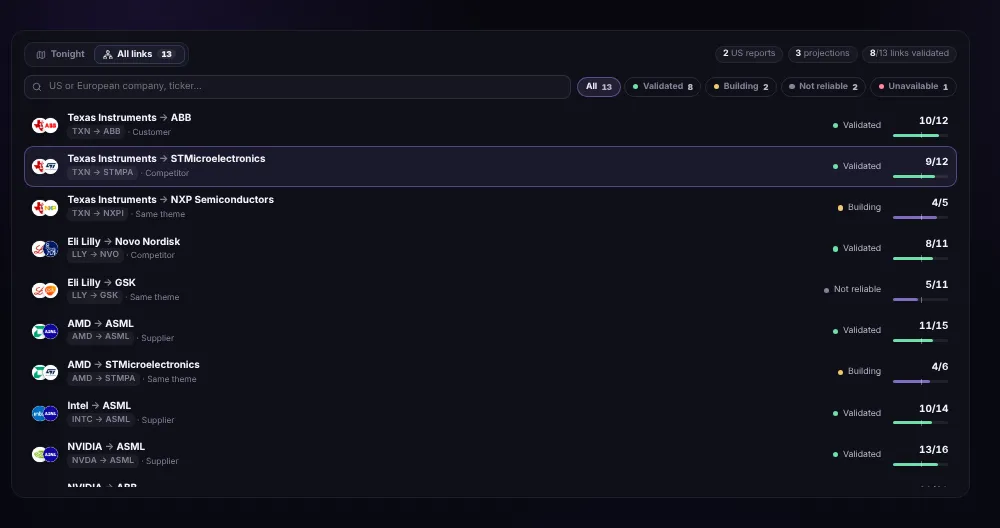
- SearchA US or European company, or a ticker.
- StatusValidated, Building, Not reliable, Unavailable, with their counts.
- A linkBoth companies, the relation, the status, and how often they moved in the same direction. Click to see it in detail.
Quiet nights
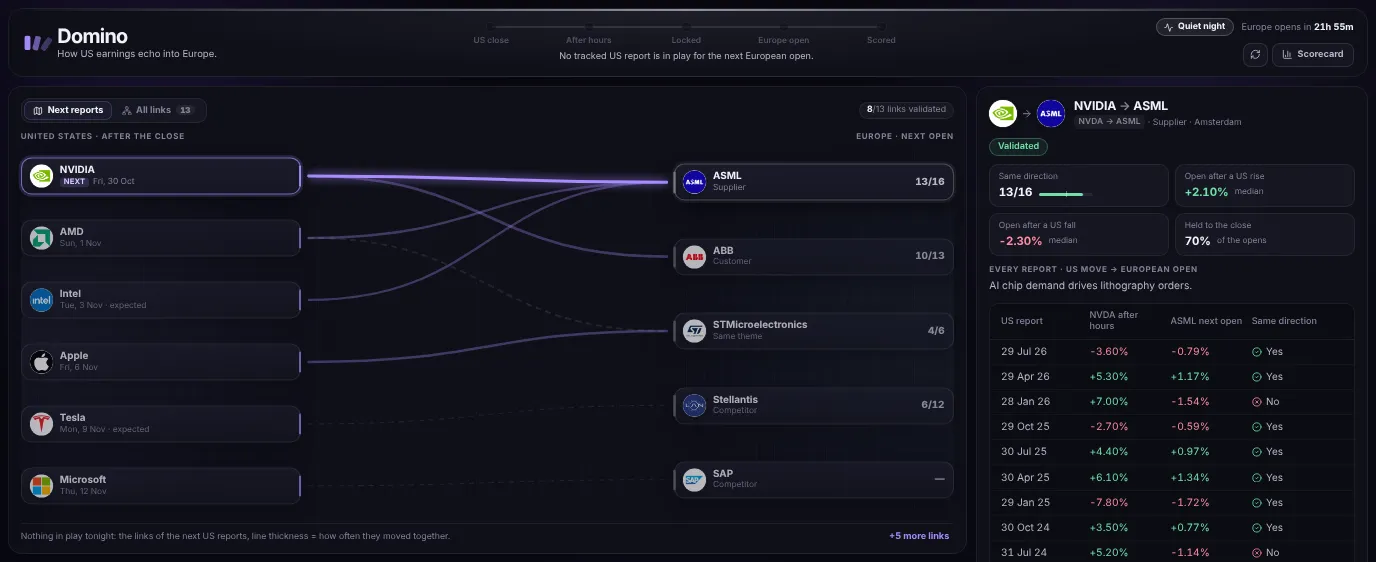
- Quiet nightNo tracked US report is in play for the next European open.
- Next reportsThe next reporting companies, with their date; Next marks the closest one.
- Past agreementHow many past opens went in the same direction, e.g. 10/12.
The scorecard
Every projection stays on the Scorecard page, hits and misses alike.
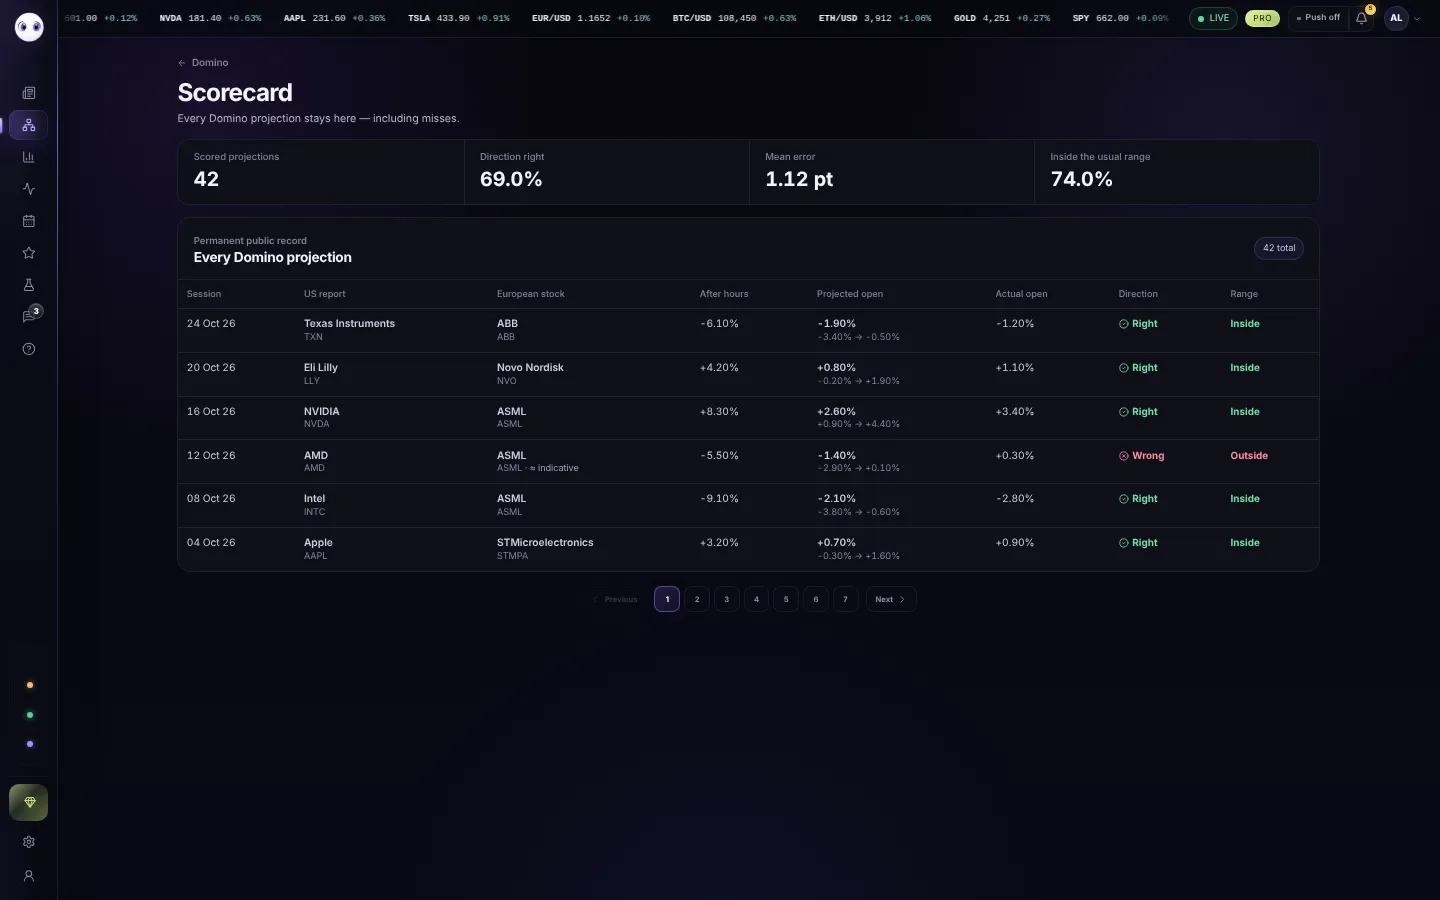
- TotalsScored projections, direction right, mean error in points, and how often the open stayed in the usual range.
- Every projectionSession, US report, European stock, after-hours move, projected and actual open, direction and range.
Screenshots use simulated prices and stories.