
Charts
Charts gathers everything about one market on a single screen: its price chart with Oyticker's stories marked on it, the company's figures, performance, risk, technical signals, earnings, macro links and the tone of the news. Pick a market on the left and every tile follows. From here, Analyze opens the full drawing workspace.
The screen at a glance
On a computer the whole dashboard fits one screen, without scrolling. On smaller screens the tiles stack in the same order. Each tile has a small i next to its title: point at it to read how its figures are computed.
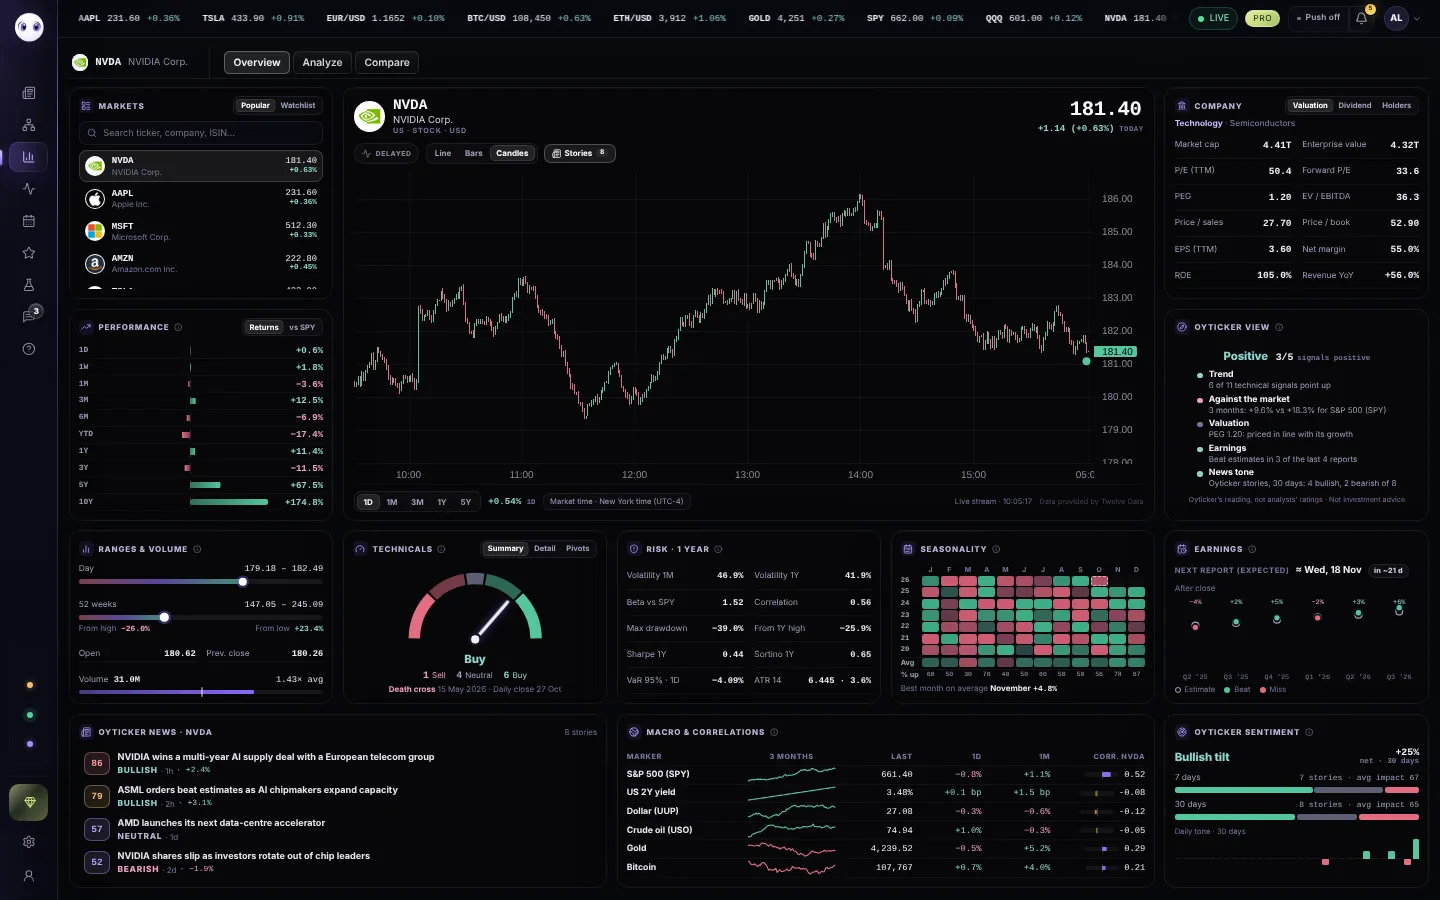
- MarketsPopular markets and your watchlist. Click a row, or search any ticker: the whole page switches to it.
- Price chartThe live chart, with Oyticker's stories marked on the candles. Analyze and Compare open from its toolbar.
- CompanyValuation, dividend and holders, for stocks and ETFs.
- PerformanceReturns from one day to ten years, and the market against its benchmark.
- Analysts' ratings or key factsThe analysts' ratings, counted, when the data has them; otherwise five facts from public data.
- Statistics rowRanges and volume, technical signals, risk, seasonality and earnings.
- News, macro and sentimentOyticker's stories on this market, how it moves with the big macro markers, and the tone of its news.
Reading the chart
The chart opens on 1D, one candle per minute of today's session. 1M, 3M, 1Y and 5Y show one candle per day. Scroll to zoom, drag to move back in time: live prices keep your zoom.
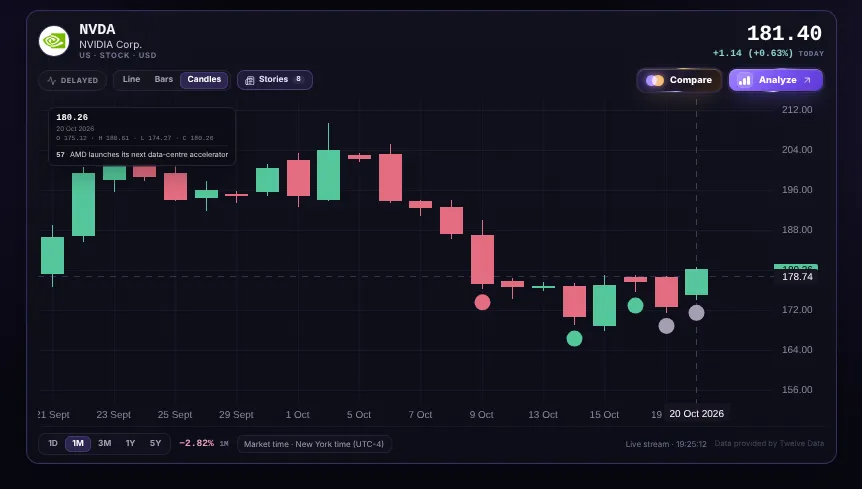
- Last priceIt flashes green or red at each change, with today's change beside it.
- StatusLIVE when prices stream in real time, DELAYED for snapshots, END OF DAY for markets updated after their close.
- Line, Bars, CandlesThree ways to draw the same prices. Candles is the default.
- StoriesMarks Oyticker's stories on the chart: green positive, pink negative, grey neutral; bigger dots for impact 80+. The number counts them.
- Compare and AnalyzeAnalyze opens the drawing workspace on this market and period; Compare opens it ready to pick a second asset.
- Candle detailsOpen, high, low and close of the candle under your pointer, and up to three of its stories, strongest first.
- Periods1D, 1M, 3M, 1Y, 5Y. The change next to them is measured over the period shown.
- Time zoneTimes in the market's own time zone, or in yours. Your choice is remembered.
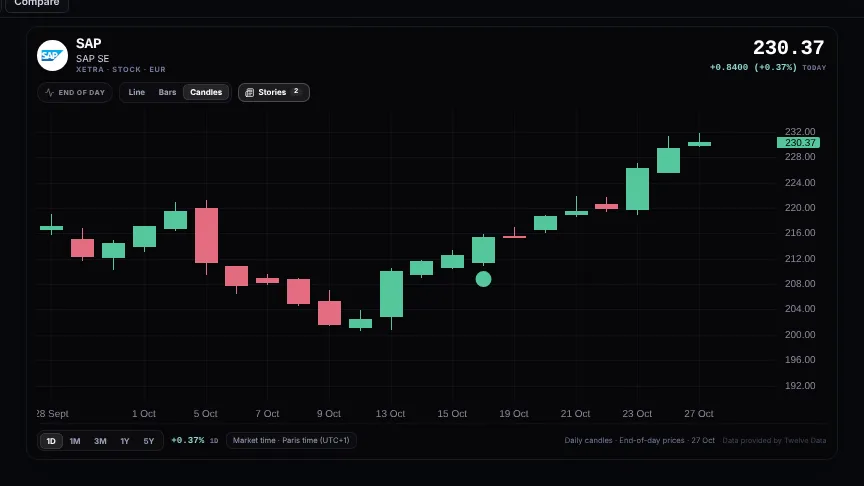
- END OF DAYPrices of this market are updated after each session's close.
- Daily candlesOn 1D, the last month of daily candles, and the date of the last close.
- Last sessionOn 1D, the change of the last session.
Finding a market
The Markets tile lists popular markets, and your watchlist under its own tab. Type in its search box to find any stock, ETF, currency or crypto: matching rows appear as you type, then the full search from two letters.
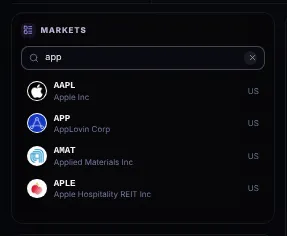
- SearchTicker, company name or ISIN. Pick a result and the page switches to it; the address follows, so you can bookmark or share the view.
- ResultsEach result shows its exchange. In the lists, rows show the last price and the day's change.
Company and analysts
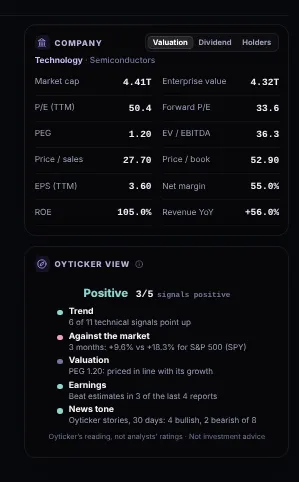
- Valuation, Dividend, HoldersMarket cap, P/E, PEG and margins; then the dividend and splits; then shares, float, insiders, institutions and short interest.
- FiguresPoint at a figure with an underline for its definition.
- Key factsWhen the data has no analyst ratings, five facts from public data: the chart's signals, 3 months against the market, the PEG ratio, the last earnings against the estimates and the tone of the stories. Each with its direction where it has one; no verdict is drawn from them.
- The signalsTrend of the daily chart, the last 3 months against the market, valuation (PEG), earnings surprises and the tone of Oyticker's stories.
Statistics tiles
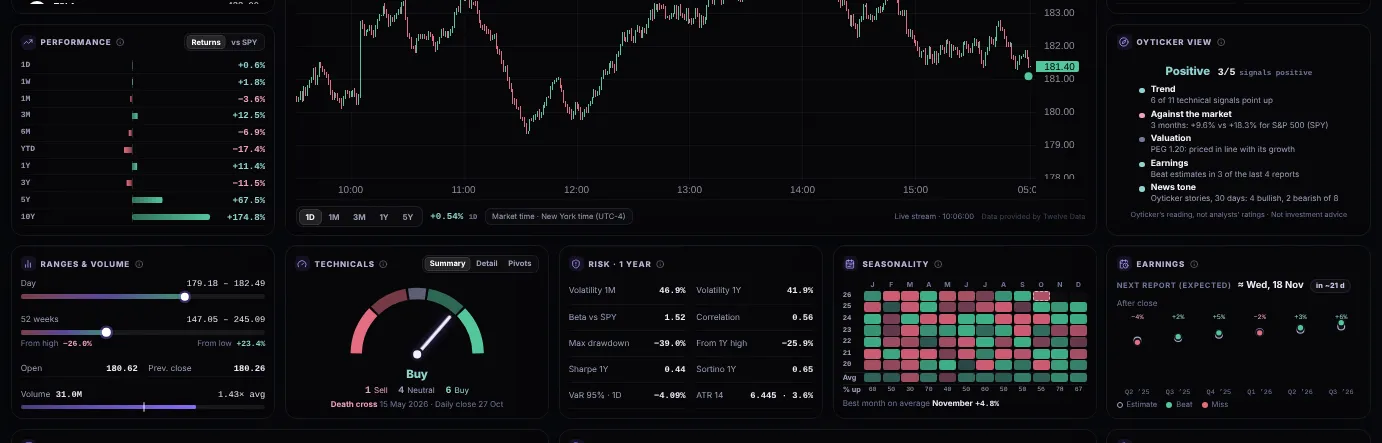
- PerformanceTotal return from 1 day to 10 years, dividends included. The vs tab draws the market against its benchmark, based 100.
- Ranges & volumeWhere the price sits in the day's and the year's range, and today's volume against its 30-session average.
- Technical signals11 daily signals (5 oscillators, 6 moving averages) counted: how many point up, down or neither, with the detail and the pivot levels.
- Risk · 1 yearVolatility, beta, correlation, worst fall, Sharpe and Sortino ratios, 1-day value at risk and average true range.
- SeasonalityEvery month of the last years in green or pink, the average month and how often it rose.
- EarningsThe next report date (marked ≈ when it is expected, not announced yet) and the last quarters: estimate in hollow, actual filled.
News, macro and sentiment

- Oyticker newsThe stories on this market, newest first: impact, tone, age and the price move since each story. Click one to read it.
- Macro & correlationsS&P 500, rates, dollar, volatility, oil, gold and bitcoin: their moves, and how closely this market followed them over 90 sessions.
- Oyticker sentimentThe tone of the stories on this market: mostly positive, balanced or mostly negative, over 7 and 30 days.
- Daily toneOne bar per day for 30 days, weighted by impact.
Screenshots use simulated prices and stories.